How it Works
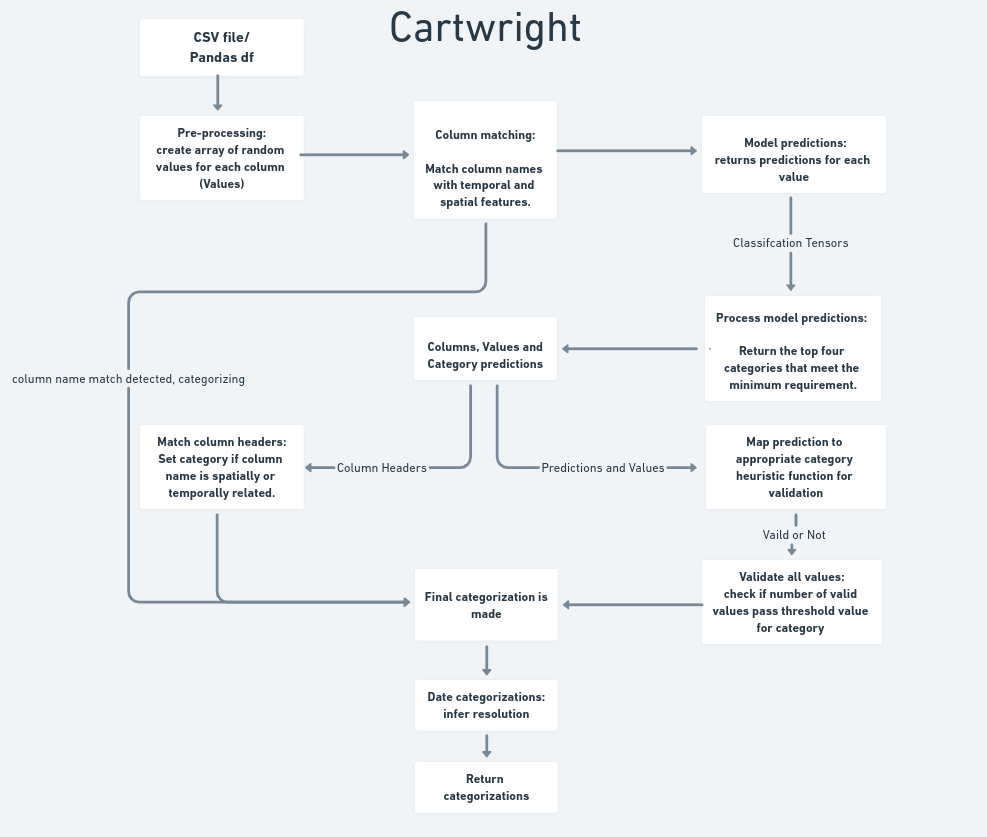
The Cartwright model is a type recurrent neural network that uses LSTM to learn text classification. The model is trained on Fake data provided by Faker. The goal was for a given spreadsheet where we expect some kind of geospatial and temporal columns, can we automatically infer things like:
- Country
- Admin levels (0 through 3)
- Timestamp (from arbitrary formats)
- Latitude
- Longitude
- Dates (including format)
- Time resolution for date columns
Cartwright Workflow:

Training the model
To do this, we generated training data using Faker along with additional locally generated data. The model was built using pytorch. We used padded embedding, and LSTM cell, a linear layer and finally a LogSoftmax layer. This model was trained with a dropout of .2 to reduce overfitting and improving model performance.
    self.embedding = nn.Embedding(vocab_size, embedding_dim)
    self.lstm = nn.LSTM(embedding_dim, hidden_dim, num_layers=1)
    self.hidden2out = nn.Linear(hidden_dim, output_size)
    self.softmax = nn.LogSoftmax(dim=1)
    self.dropout_layer = nn.Dropout(p=0.2) After a few iterations the model was performing well enough with accuracy hovering around 91 percent.
The Heuristic functions
The heuristic functions ingest the prediction classifications from the model along with the original data for validation tests. If the data passes the test associated with the classification the final classification is made and returned. If Cartwright failed to categorize a feature it will return ‘None’. We provide a theshold value for each category that determine how many of the samples can fail. Usually we aim for greater than 85 percent of samples pass the validation test for a category. If the heuristic functions can’t validate enough samples for a feature we try the next best category prediction from our model output. That continues until validation passes or we run out of model predictions that meet a certain minimum similary value.
Column Header Fuzzy Match
This is the most simple part of the workflow. For each column header we try to match that string to a word of interest. If there is a high match ratio we categorize the feature apporiately and set match_type value to “fuzzy”. For more info you can see Fuzzywuzzy docs here.
Automatic Temporal Resolution Detection
If a dataset contains data at evenly spaced intervals, the resolution is automatically detected according to the following process:
- convert all unique dates/times to unix timestamps
- sort the timestamps and compute the delta time between each
- find the median of the deltas
- characterize the uniformity of the deltas
- if all deltas are identical (to within some small ϵ), mark as
PERFECT - if the maximum deviation from the median is less than 1% the magnitude of the median, mark as (approximate)
UNIFORM - otherwise mark as
NOT_UNIFORM
- if all deltas are identical (to within some small ϵ), mark as
- if the deltas are perfectly or approximately uniform, find the closest matching time unit from a preset list:
millisecond(1e-3 * second)second(1)minute(60 * second)hour(60 * minute)day(24 * hour)week(7 * day)year(365 * day)month(year / 12)decade(10 * year + 2 * day)century(100 * year + 24 * day)millennium(1000 * year + 242 * day)
in the future, temporal units will be drawn from a more comprehensive units ontology
- convert the median delta to a proportion of the matched unit, and set as the temporal unit for the dataset
Currently milliseconds may experience issues due to floating point precision errors, and thus may not be detected by this process.
time resolutions are represented by a TimeResolution object with values: uniformity enum, unit enum, density value (in the unit given), and mean error value. If the detection process fails, the object will be None